Are you looking to buy or sell in cottage country? I am Brad Sinclair, a dedicated Real Estate Sales Specialist with Re/Max Professionals North. As a strategic marketer and expert problem solver, I specialize in navigating the rural and waterfront markets of the Kawarthas, Peterborough, and Haliburton areas. We are the leading authority in this region. We don't just list homes; we look to earn your business by bringing you deep local knowledge, fierce representation, and unmatched service.
Tuesday, September 30, 2025
Week in review: Real Estate Market Watch and Update (September 22nd-September 28th2025) Peterborough and Haliburton
Monday, September 22, 2025
Week in review: Real Estate Market Watch and Update (September 15-September 21 2025) Peterborough and Haliburton
Real Estate Market Brief September 22nd, 2025 Edition Peterborough and Haliburton
The key takeaways from the real estate data are:
In Peterborough non-waterfront:
- The number of new listings increased from 90 to 106.
- The number of sold properties increased slightly from 29 to 31.
- The average sale price decreased from $641,924 to $604,601.
- The average days on market increased from 30 to 47.
In Peterborough waterfront:
- The number of new listings decreased from 22 to 16.
- The number of sold properties decreased from 9 to 5.
- The average sale price increased significantly from $654,222 to $1,035,600.
- The average days on market increased from 48 to 63.
In Haliburton non-waterfront:
- The number of new listings increased from 13 to 19.
- The number of sold properties decreased from 9 to 7.
- The average sale price decreased from $475,444 to $384,214.
- The average days on market remained the same at 54.
In Haliburton waterfront:
- The number of new listings decreased from 19 to 14.
- The number of sold properties decreased from 8 to 5.
- The average sale price decreased from $812,450 to $746,000.
- The average days on market increased from 38 to 68.
The key changes seem to be a drop in Peterborough waterfront sales but a significant increase in average price, along with a general decrease in sales and prices in the Haliburton market compared to the previous week.
In the News:

If you are looking to either Buy or Sell, contact me at 705-927-6236
Brad Sinclair, Sales Representative
Team Lead at The Brad Sinclair Team
Royal Heritage Realty
Your inside source to cottage country
Not intended to solicit clients under contract

If you are looking to either Buy or Sell, contact me at 705-927-6236
Brad Sinclair, Sales Representative
Team Lead at The Brad Sinclair Team
Royal Heritage Realty
Your inside source to cottage country
Not intended to solicit clients under contract
Wednesday, March 26, 2025
Week in review: Real Estate Market Watch and Update (March 16-March 22, 2025) Peterborough, Kawarthas and Hastings
Real Estate Market Report for Peterborough, Kawarthas and Highlands (Hastings). Get a snapshot of what is happening in your Real Estate Market for the week of March 16th to March 22, 2025
Looking at the numbers, the data suggests that lower-priced listings are selling below the average list price in all three areas, which could indicate an influx of first-time buyers. The City of Kawartha Lakes real estate market appears to be in a slower period, with lower new listings and overall sales compared to Peterborough and Hastings counties. However, the stronger sales activity and total dollar value of real estate in Peterborough and Hastings suggest a more robust market in those regions. Overall, the data paints a nuanced picture of the regional real estate trends, with some areas showing more activity and demand than others.
Peterborough and Peterborough County
# of Current Active Listings
718
# of New Active Listings
128
Average List Price
$960,428
Average Sales Price
$681,069
Average Days On the Market
28
Total Dollar Value of Real Estate
$24,518,499
City of Kawartha Lakes
# of Current Active Listings
519
# of New Active Listings
60
Average List Price
$818,762
Average Sales Price
$785,268
Average Days On the Market
34
Total Dollar Value of Real Estate
$17,275,900
Hastings County
# of Current Active Listings
958
# of New Active Listings
116
Average List Price
$711,665
Average Sales Price
$512,012
Average Days On the Market
56
Total Dollar Value of Real Estate
$21,504,513
Brought for you by: Your local Realtor®

If you are looking to either Buy or Sell, contact me at 705-927-6236
Brad Sinclair, Sales Representative
Team Lead at The Brad Sinclair Team
Royal Heritage Realty
Your inside source to cottage country

If you are looking to either Buy or Sell, contact me at 705-927-6236
Brad Sinclair, Sales Representative
Team Lead at The Brad Sinclair Team
Royal Heritage Realty
Your inside source to cottage country
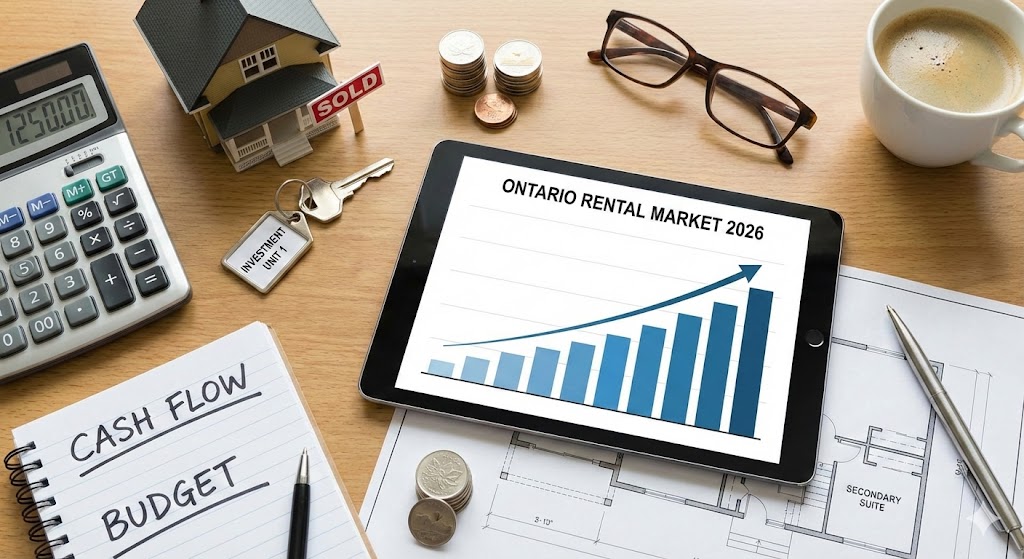
Buying Your First Investment Property in Ontario
Buying your first investment property is more than a financial transaction; it’s the launch of a small business. In Ontario’s 2026 real esta...

-
Is the "Free Ride" Over? Why Charging for the Peterborough Zoo is the Wrong Move If you grew up in or near Peterborough and you f...
-
I saw one of Peterborough's "No More MP Ferreri" signs today. I was surprised; it bothered me. After some thought why it bot...


